Debug display
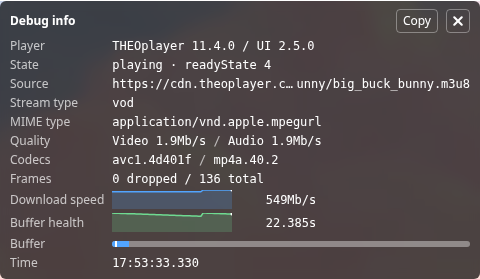
The debug display is an overlay panel that shows playback diagnostics, such as the current source, quality, buffer health and live latency. It is meant for developers, and is not part of the main Open Video UI bundle.
Add it to your player
Import the separate @theoplayer/web-ui/debug entry point. This entry point is only available as an ES module.
import '@theoplayer/web-ui/debug';
Then place a <theoplayer-debug-display> in the overlay slot of your UI.
Optionally, add a <theoplayer-debug-button> to toggle the panel from the control bar.
<theoplayer-default-ui configuration='{"libraryLocation":"..."}' source='{"sources":{"src":"..."}}'>
    <theoplayer-debug-display slot="overlay" hidden></theoplayer-debug-display>
    <theoplayer-debug-button slot="bottom-control-bar"></theoplayer-debug-button>
</theoplayer-default-ui>
If you use Open Video UI for React, see Debug display in React.
Bookmarklet
To inspect a player on any website that uses Open Video UI, without changing its code, use the debug display bookmarklet. Create a new bookmark in your browser, and paste the following code as its URL:
javascript:(()=>{const s=document.createElement('script');s.src='https://cdn.jsdelivr.net/npm/@theoplayer/web-ui@2/dist/THEOplayerUI.debug.bookmarklet.js';document.head.append(s)})()
Click the bookmark on a page with an Open Video UI player to show the debug display. Click it again to hide it.
The bookmarklet requires Open Video UI for Web 2.6.0 or higher.
It does not work on websites whose Content Security Policy blocks scripts from cdn.jsdelivr.net,
nor on players inside a cross-origin iframe.
It works on players inside same-origin iframes.